---------------------------------------------------------------
---------------------------------------------------------------
the Pythagorean Spiral
It should be noted that arithmetic expansion occurs unilinearly, as a diaganol vector on a cartesian coordinate graph.
Now, exponential expansion occurs when the exponent of the integer is increased. For example, if one takes the exponential expansion of the numberline of arithmetic expansion, such that, 1^2, 2^2, 3^2, etc... where it then forms the summed numberline, such that, 1, 4, 9, etc....
A third kind of expansion rate exists, however it has been considered more or less esoteric, because it forms a very specific inherent pattern when graphed. This kind of expansion rate is associated with the Fibonnaci sequence of numbers, such that, 1, 1, 2, 3, 5, 8, 13, etc... where the rate of expansion is determined by the addition of only the preceding two numbers to form the sum digit third in the sequence. When this sequence is graphed as points around an origin in a cartesian grid, it forms a spiral, and this spiral has been found everywhere throughout nature, from the branching patterns on plants to the proportions of the human body. This is the pattern I call, for shorthand, phi.
Phi over Pi can be easily demonstrated using simple mathematics.
Apply the Pythagorean theorem, thus: (for any right triangle with legs A and B and hypotenuse C) a^2+b^2=c^2.
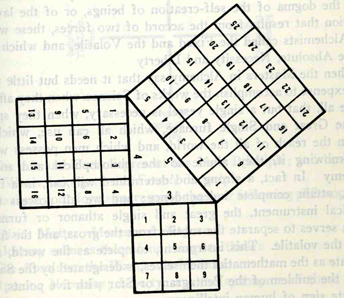
This can be depicted with a triangle surrounded by three squares. The base (number per side) of each square will be a sequential progression, such as 1,2,3. Thus, for example, the square of 3 plus the square of 4 equals the square of 5.
As I have described, there are three forms of expansion rate in three dimensions. One is arithmetic, one is exponential (Pi) and one is the Fibonnaci sequence (phi).
First let's look at the arithmetic rate as it relates to the Pythagorean theorem, and then we will see how to combine the exponential and Fibonnaci sequences using the Pythagorean theorem and thus to create a three dimensional representation of phi/pi.
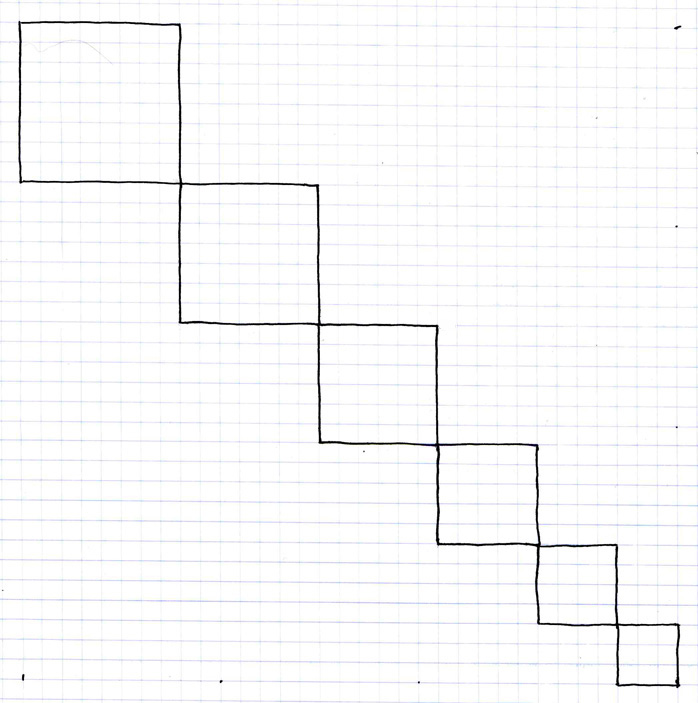
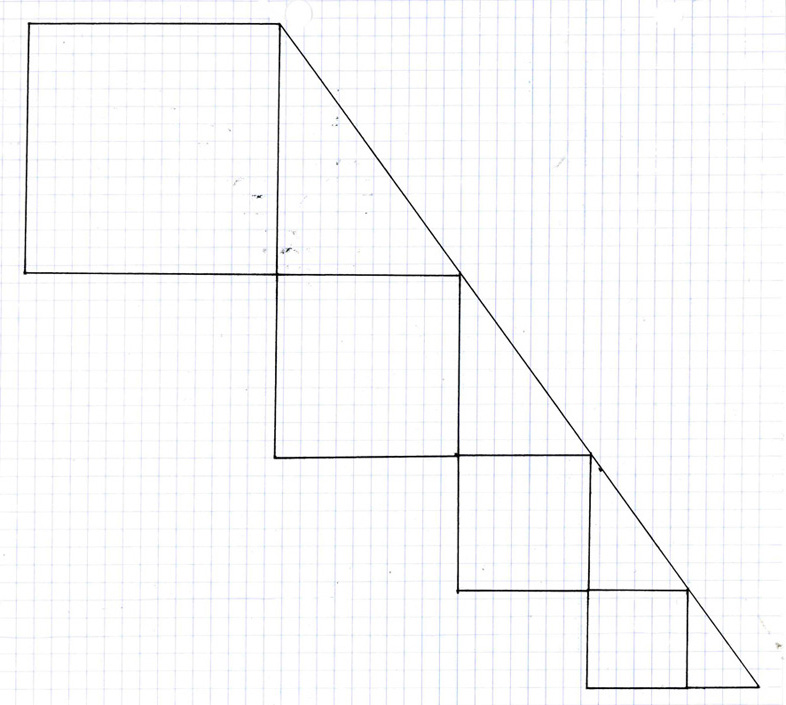
This graph shows us the arithmetic expansion rate in two dimensions. From the square of 3 units (base three) in the lower right to the base 8 square in the upper left, the basic unit of measure (the square of base one, or the one by one square, also called one squared, written 1^2) is here the same throughout.
Now, let us begin to look at what happens to this arithmetic expansion rate graph when we apply the Pythagorean theorem. To do this we must first construct the following graph, complementary to the preceding graph, and then we can combine the two using the Pythagorean theorem.
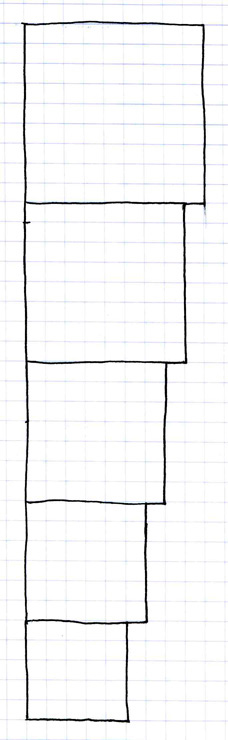
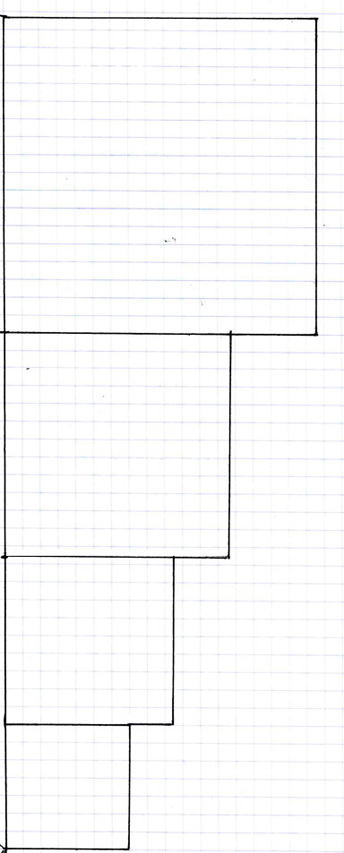
Although it differs from the shape of the last one, this graph also expresses arithmetic expansion. Just as the last graph had shown us the squares from three to eight, this graph shows us the squares from base five to base nine. While the graph of three to eight showed us arithmetic expansion along a forty-five degree angle, this graph, from base 5 to 9, shows the same expansion rate when it occurs along a right angle, that is, a straight vertical line. Thus, here, the arithmetic expansion rate is expressed by the growth from one square to the next by one base unit at ninety degrees from the vertical line.
Now let us combine these two graphs, the one from base three to base eight along a forty-five degree angle and the other from base five to base nine along a ninety degree angle, using the Pythagorean theorem, and see what we find out for the arithmetic rate of expansion.
Here we can see the result of combining these two arithmetic rates of expansion to form a Pythagorean triangle, from which we can then derive the Pythagorean mathematical theorem of trigonometry. In the lower right corner we find the standard Pythaogrean triangle formed by the base three and four squares when we apply the base five square to them at a 54° angle. The Pythagorean triangle is thus formed from the 90, 36 and 54° angles between the base 3, 4 and 5 squares. However, beyond this we observe the 54° angle at which we have tilted the previously vertical graph and the 45° angle of the other graph diverge, and that there appears to be no further congruency between the measurements of the two sets of squares.
Therefore, the results of applying the Pythagorean theorem to the arithmetic expansion rate is that it yields a discrepancy between the alignments of any of the squares formed of the original base unit along an increasing degree defined by the difference between the 54 and 45° angles. All of this can be used in two-dimensions to model how artihmetic expansion occurs relative to the Pythagorean theorem. In arithmetic expansion, the size of the base unit is constant, and each interval increases the measurement by one of the same size basic units, the one by one square, or, simply, 1^2.
So, next let us look at the exponential rate of expansion, and apply the same, step-by-step process as before to compare it to the arithmetic rate of expansion using the Pythagorean theorem triangle that we used to build the arithmetic expansion model, and finally we can compare the exponential model with one based on the Fibonnaci sequence, also by using the Pythagorean theorem triangle.
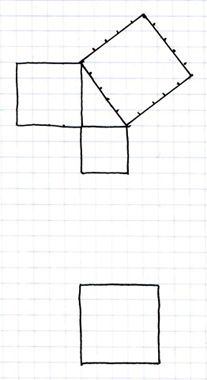
First, let's begin with the basic 3,4,5 square Pythagorean triangle. Here we see that each of the three sides of the triangle is comprised of a single base unit of measurement, the one square. All this means is that, if we draw a five by five square, and turn it at a 54° angle, it will complement the squares of 3 and 4 that use the same unit measurement. This assertion is self-evident to the arithmetic expansion, and taken for granted in most Euclidian geometry. However, for this next part we will need to consider the base unit (1^2) being alterable and relative.
Having looked at the standard Pythagorean theorem triangle of sides 3,4,5, and seen that, using a constant base unit, we cannot combine the 45 and 90° graphs of the arithmetic expansion rate, let us now consider how to plot a similar graph for the arithmetic (pi) expansion rate using the Pythagorean theorem triangle.
This is a series of expanding squares constructed at the angle of inclination of the Pythagorean theorem triangle (54°), instead of at the 45° angle of inclination of the arithmetic rate of expansion graph. Here we can see that, beginning with the smallest increment of Pythagorean theorem triangle larger than the 3^2+4^=5^2, or simply the 3,4,5 triangle, that is, beginning with the Pythagorean triangle whose shortest side length is 4, in the lower right corner, and then continuing up at 54° to the square in the upper left, we see there is a definite expansion from one increment to the next, and that this rate of expansion yields a larger sized square than the same number of increments on the 45° angle arithmetic expansion graph. In point of fact, the expansion rate only appears to have increased between the arithmetic and the exponential rates of expansion. In truth, it is not the size of the squares that is expanding. It is the base unit. The 1 square.
This fact becomes more apparent when we observe the exponential rate of expansion at ninety degrees (right-angled) rather than at a 54° angle. Again, this graph is the same graph as that for artihmetic expansion wherein there was the addition to each increment of one base unit at right angles to the vertical sequence. The only difference between the artihmetic and exponential expansion rates is that, in the arithmetic expansion rate, the base unit (1^2) has a constant measurement, however, in exponential expansion, the base unit increases at a rate determined not by 45 or 90° angles, but instead by 36 and 54° angles. Therefore, just as the last graph represented exponential expansion at 54°, this graph depicts exponential expansion at 36°. However, I can't stress enough that this 36° angle exponential expansion rate graph is identical to the 90° angle arithmetic expansion rate graph, and that the only real difference is the angle of perspective from which we, the subjective observer, are viewing the same specific shaped objects. In short, the base unit appears to increase only because of foreshortening of perspective. In other words, the one square is always the one square, but if we rotate it, we can observe various different relationships based upon it occuring at various different angles relative to it.
So, let us take the 36 and the 54° angles of exponential expansion rates and combine them using the Pythagorean theorem.
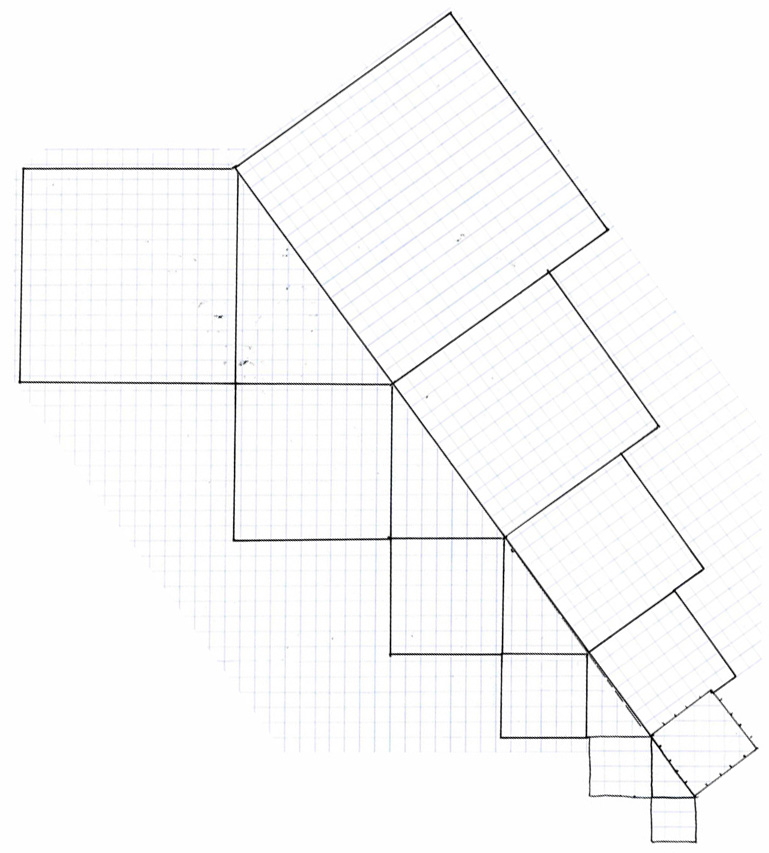
This is the result of combining the 36 and 54° angle exponential expansion rate graphs. Here we see that, because the expansion rate occurs at the same angle as that of the Pythagorean theorem triangle, the squares formed by the exponential expansion rate perfectly align to form a series of incrementally increasing Pythagorean theorem triangles. We can say that these triangles and squares are all congruent to their smaller and larger counterparts because the only difference between them is the size of the base unit (the one square) that comprises their fundamental measurement. In this graph we see that, had we stayed with the same base unit (the one square) that we used to construct the smallest increment Pythagorean theorem triangle (the 3,4,5 in the lower right corner), then none of the areas of the rest of the squares of equivalent triangles would be exactly equal to a round integer of 1X1 base units. Again, in point of fact, the only other known Pythagorean triangle than the 3,4,5 Pythagorean triangle (aside from the multiples of the 3,4,5 triangles such as 6,8,10) that has squares of exactly even integers in the same unit base (the one square) as the 3,4,5. This other Pythagorean theorem triangle does not occur until the smallest square is equal to 693 1^2 base units, the larger square equals 2045 base units per side, and the middle sized square between them is equal to 1924 square base units.
So, having now completed the process of contrasting the arithmetic and exponential expansion rate Pythagorean theorem triangles, let us compare the sequence of Pythagorean triangles that expands exponentially (pi) with the Fibonnaci sequence type of triangle (phi), to determine how they relate and compare.
To do this will take three steps.
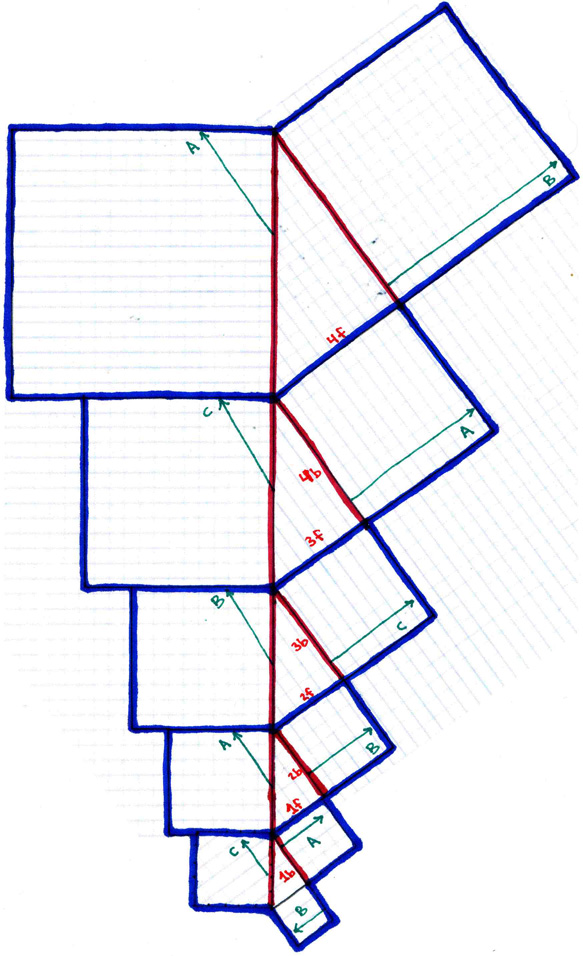
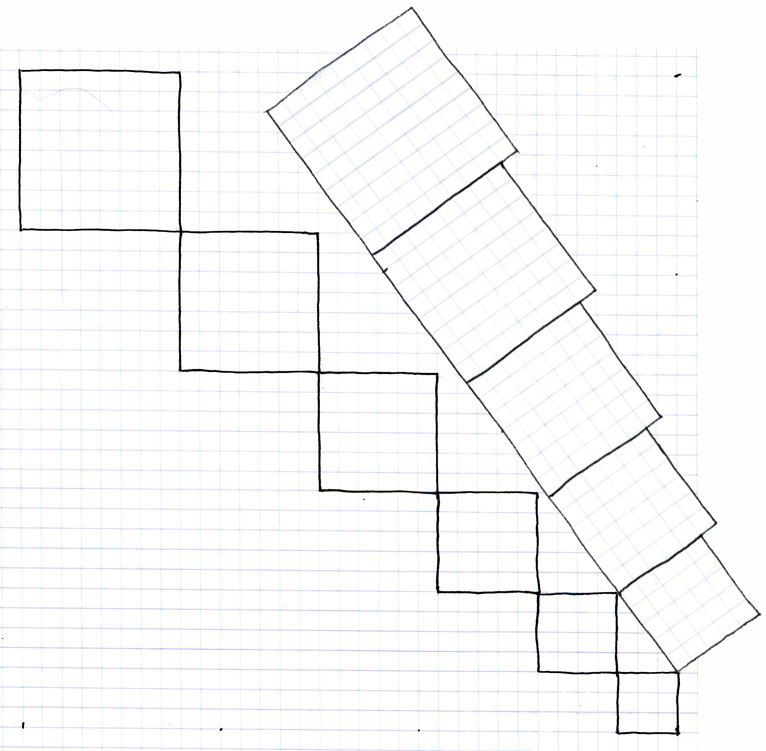
First, we take the "straight" sequence of exponentially expanding equivalent Pythagorean triangles and label it as above. The blue lines represent where to cut to separate between the increments. The red lines represent where the increments fold when they are correlated using the phi spiral. The green lines represent where the folded incremenets align.
So, to complete this step, print out the above diagram, cut it into five separate pieces along the blue lines, then tape the back of one each larger increment to the front of each smaller increment following the series of numbers indicated in red (thus: tape the front, coloured side of "1f" to the back, blank side, behind the label "1b" of the next smaller increment, and tape the back, blank side behind the label "4b" to the front, coloured side of "4f" on the next larger increment), and arrange the cut and taped pieces such that they appear thus:
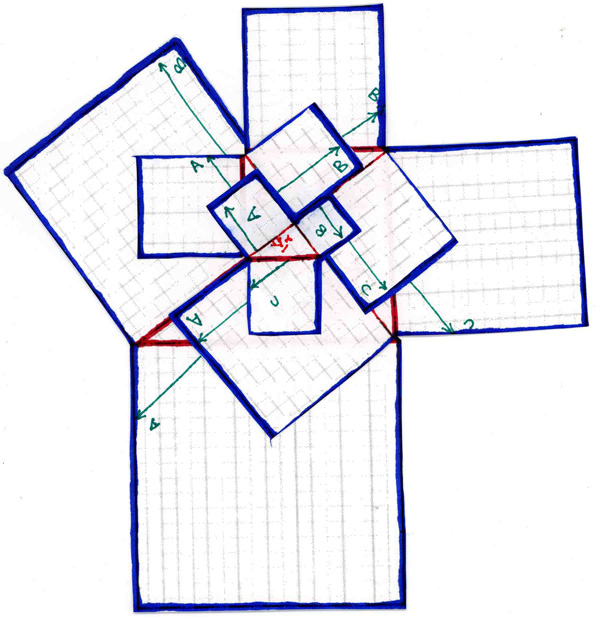
Represented in red, you can see in this cut and taped together version the beginning formation of the equiangular spiral that I will compare to the accute angled spiral in the next section. The equiangular spiral is equivalent to the exponential expansion rate of Pythagorean triangles. Thus, the equiangular spiral is equivalent to pi, since pi is equivalent to the exponential expansion rate of Pythagorean triangles.
However, as you can see, the letters along the alignments of green arrows do not all match each other in the cardinal quadrants. There is still one more step of topological transformation to complete before we see the final phase of this model comparing the pi exponential expansion rate with the Fibonnaci rate of expansion.
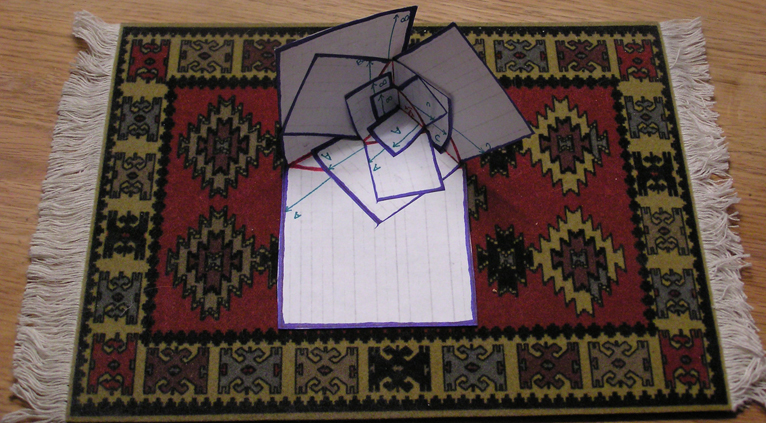
To complete the final step in creating the phi/pi model in three dimensions, and thus combining the equiangular spiral of the Pythagorean exponential expansion rate with the accute angled expansion rate associated with Fibonnaci's sequence, we only have to fold and paste the model four times, connecting the letters of each increments three green arrows with the same lettered arrows of the increments smaller and larger than it. The result of this is that now the red outlined Pythagorean (or pi) spiral is complemented by the three necessary directions (the green arrows) to form the accute, or triangular, Fibonnaci (or phi) spiral.
---------------------------------------------------------------
---------------------------------------------------------------