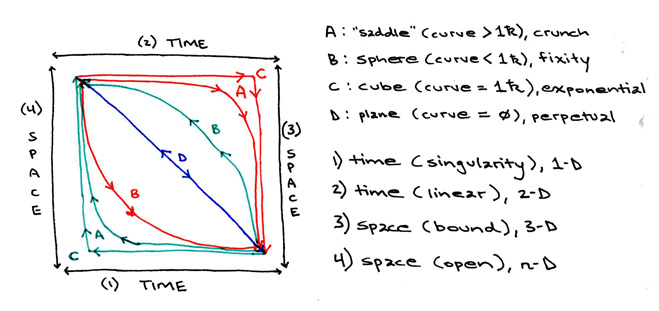
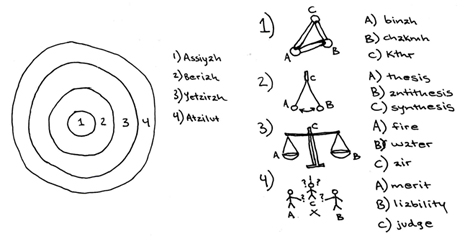
Here is how the "law" of three relates to the rule of fours, such as the four elements, or the three spatial directions over time.
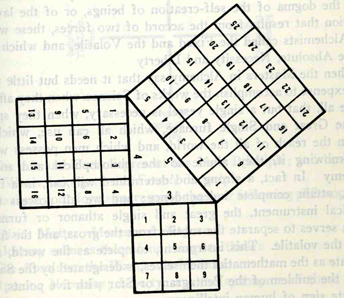
According to the Zohar, for example, there are four kabbalistic "worlds." According to the reckoning of the elders in the Zohar, there must therefore be a "law" of three in each of the four "worlds." And so they established judgment, balance, a pendulum and three supernals, three for each of the four, and thus, there were ten below three in one, and twelve altogether. This was pleasing to the elders because they saw that the "three in one" of the supernal tenth was the Right Knowledge of the Pythagorean Triangle, whose ratio of lengths between its three points is 3:4:5, and whose calculation is a^2+b^2=c^2.
This is a somewhat more scientific depiction of the essential topologies associated with the relative force-carrying particles for the four elemental forces of our local universe: http://www.benpadiah.com/MISC_diagrams/img534_copy.jpg More about this can be found on my site here: http://www.benpadiah.com/MISC_diagrams/pages/equations.html#RdS
This was all according to the reasoning of the elders, that is the Safeds of Spain, butit was based on observations made by their ancestors, that is, to us, the ancients. Just as we now study their Zohar, the Sefardic Septamanians studied the apocryphal scriptures of the Hermetic Pythagoreans. So, Moses DeLeon came to the conclusion that the "law of three" applied to the "four worlds" because the Pythagorean theorem could be applied to all of nature.
However, the four worlds themselves extend beyond only our local universe, which is simply the fourth comprised of nine subtended to the tenth comprised of three. This lowest, or material world, (Atzilut in the above diagram) was called Malkuth and was comprised of the four-elements as a shadow of the three dimensions of space and the fourth of linear time.
This was hinted at in the knowledge of the ancients, who tell us that the law of seven derives from the law of three applied to the four worlds no less than does the formation of the twelve. The four worlds of Hebrew Kabbalah and the seven worlds of Hellenic Greek Hermeticism were combined as the seven planets and the twelve houses of the zodiac even long before the time of the ancients, the predecessors of our own elders in keeping with this tradtion. This is because 3+4=7 just as does 3x4=12.
Therefore, we cannot necessarily say that the "law of three" does indeed apply to itself to form the nine to which we can subtend the tenth of three, and thus by which form the three plus one of the four. We cannot, therefore, even determine the difference between the five physical sense and the sixth sense of the psyche if we cannot distinguish the difference between the six psychic questions and the six physical directions.
So, what does this all have to do with "twinning"? Has it not been said that, in order to "self-deuplicate" we must go "three deep"? What, then is the third step of the process of self-duplication? It is simply realising for yourself, as if in an epiphany from a point of view above, that you are "twinned" with another, or with the idealogy of a group. To realise this, you must remember to "count yourself." When you "look through the eyes of another" you see through two pairs of lenses. Do not forget to count that which is doing the "looking" and "seeing" itself.
Now, the law of three, in itself, is quite simple. I have demonstrated how we cannot necessarily COMPOUND the law of three. That would be radioactive. That would be a pyramid scheme. No, we cannot multiply or double the "law" of three in itself. We cannot COMPOUND it, we cannot SQUARE it, we cannot DUPLICATE the law itself. The law of three is the law of three in itself alone. There is no law of four, no law of ten, no law of twelve, thirty-six, sixty-four or seventy-two for the law of three. There is only the law of the three for the law of three. From this third point of view, there is only that which is beneath and within itself. There is only the law of three in itself.
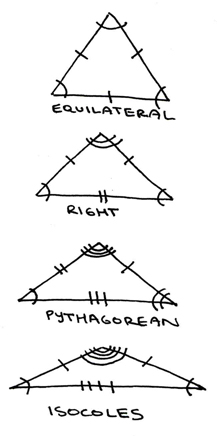
There is something interesting about the law of three: all the attributes so far discussed can be applied to triangles. The triangle itself is inherently six: three angles and three lengths. This holds true even on a curved surface, such as a sphere, where the angles can each be 90 degrees (forming 1/4 of the hemisphere). Here we see the 3 and the 4 of the ancients again, resembling the (3+2)x(4+2)=3x(3x4) of the five by six zodiacal dekans.
The equilateral trinagle's base angle is 60 degrees. The right triangle's non-right angles are both 45 degrees. The Pythagorean triangle's base angle is 30 degrees. The base angle of the isoceles triangle is twenty.
Here are some special cases of these types of triangles where certain angles and certain lengths combine to form certain theorems.
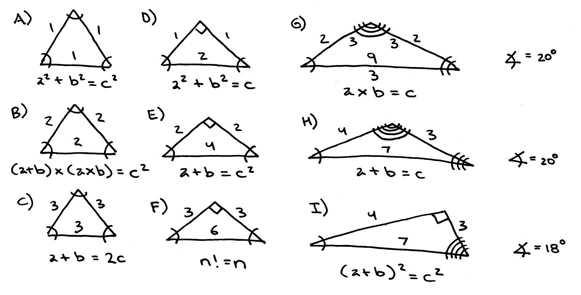
Now, let's consider the special cases whose equations are really restatements of one another, or rather, are the same.
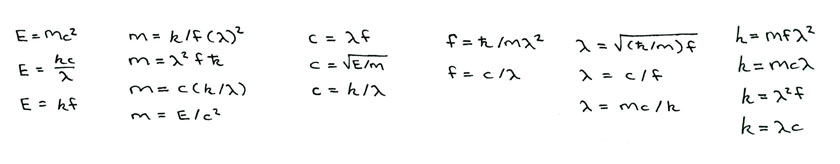
Even though the ratios of lengths and angles are drastically different, we see equation H also applies to diagram E, that equation E also applies to diagram B, that equation I also applies to diagram H and vice versa, that the equation E holds true for the special case (3,3,9) of diagram G, etc. Let's consider a couple "special cases" in particular: diagrams A and F. We can see that equations A and F are interchangeable, and that the equation for A is actually the same as a^2+b^2=c^2, the Pythagorean theorem describing the base thirty Pythagorean triangle. Also notice the equations H and I are interchangeable between the diagrams H and I, and are a means of "factoring out" the squares of the Pythagorean theorem.
All of these being triangles, and all applying to the "law of three" all these different ratios represent different patterns of harmonic vibrational frequencies that occur not only within and through the realm of the mind (brain-waves) but also permeate and fill in the realm of matter. In other words, the "third step" of twinning involves mind over matter. The first step is telepathy. The second step mind-control. The third step is telekinesis. I'll come back to that in a moment.
Because all of these triangles have three angles and three lengths, any pair of three attributes can be assigned to any of these diagrams at once. For example: consider the special cases H and I. Now apply Kthr to the great angle, Chkmh to the mdeian angle, and Bnh to the least angle. Then define the seven subtended sefirot as length of the hypotenuse seven. Between Bnh and Kthr there are four (YHVH), but between Chkmh and Kthr there are only three (YHV). Again, three plus four is seven and three times four is twelve.
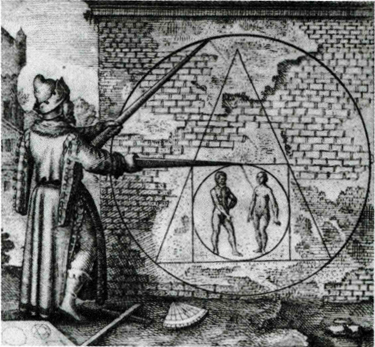
Let's consider two special cases more. Many of you are familiar with the saying "to square the circle" or "square circles." This saying dates back to antiquity, and the measurements of Pythagoras and his contemporary geometres. Although little of this material is available to us nowadays, more of it was available to the elders before its confiscation or destruction in the interim since then. Consider this "alchemical" depiction of the "philosopher's stone" as a geomtric depiction of the "squared circle."
The saying "to square the circle" actually dates back to the ancient reckoning of pi as a ratio between a circles circumference and its area. Pi, estimated by the ancients as approximately 22/7, is determined by comparing the radius of a circle and the square of the transcendental number, Pi. To determine the area of the circle relative to the area of the square, you have to "square the circle." This is done, basically, like the following:
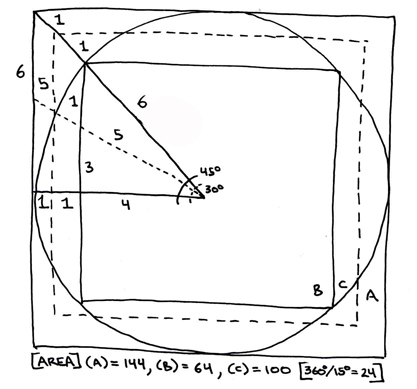
You can see many of the "special cases" of triangles involved in this diagram. This diagram basically depicts three areas: A) the greater square, B) the lesser square, C) the area is the same for both the middle square and the circle. Further examination of the difference in degrees yields the origin for the difference between the 360 degree circle and the 365.25 day year.
The primary components of the "squared circle" are the 3,4,5 Pythagorean triangle and the 45/45/90 degree right triangle. Although neither of these are "special" in this case, nonetheless we can see many, now familiar, triangles hidden within.
Of course, it is also common knowledge that if you graph the squares formed by these two types of triangle: the 3,4,5 Pythagorean and the 45/45/90 degree equilateral against one another, then you will form the phi/pi spiral. However more on this matter need not be said now.
So, after all this, what does it mean to "self-duplicate" or to "twin"? It means to go "three deep." This means that, through learning to see through another (telepathy), to speak through another (mind-control), and finally by applying (teleknises) the law of threes (triangles) to physical objects (vibrational ratios) we can learn mind over matter.
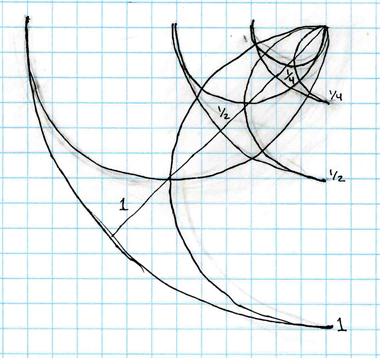
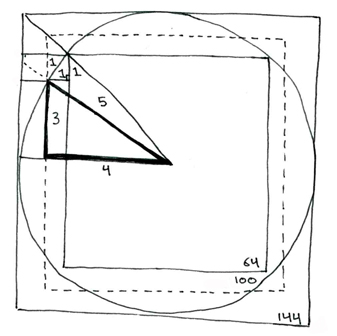
Here is the crux of the Pythagorean Triangle, conjoined at the measurement of the "Golden Mean" with a right equilateral triangle.
The non-right angle measures are 45/45 and 30/60, such that between the "upper" and "lower" triangles there is a measure of fifteen degrees difference.
In the above diagram all the units numbered "one" are the same measure.
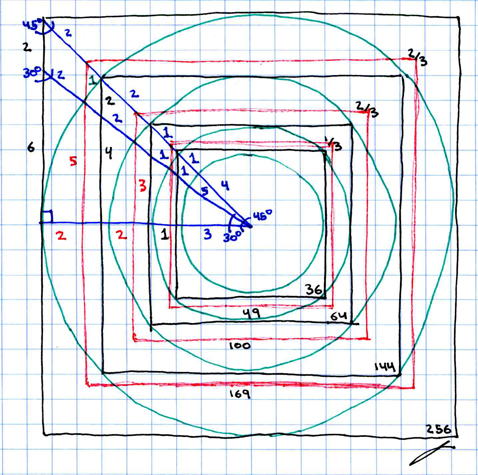
There are two ways to apply the "Golden Mean" of the Pythagorean triangle to determining the area of a circle. One is to measure the radius of the circle as the base, longer, horizontal leg of the triangle. The other is to measure the radius of the circle as the hypotenuse of the Pythagorean triangle. Although these are both essentially the same model, you can see that, applying the former method (radius=base leg) to the basic theorem, you will be measuring a smaller amount of space than if you measure by applying the latter method (radius=hypotenuse).
Therefore notice that the use of the "Golden Ratio" harmonic number sequence of 3:4:5 yields base 6,7,8 square circle areas.
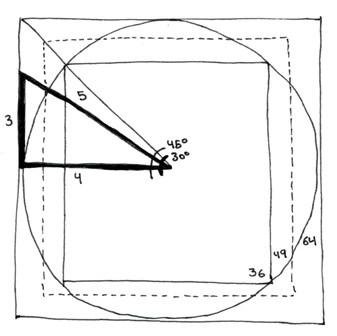
The second type of "Golden Ratio" application of the Pythagorean triangle has already been shown (at the end of my last post, above). It is the same as the one I now give here (below) in that the radius is five in both.
Here we can see that, by measuring the circle's radius as the hypotenuse of the "Golden Ratio" Pythagorean triangle, we can yield the larger areas of the base 8,10,12 squared circles.
Therefore, these are the two ways to yield a "square circle" from applying the Pythagorean triangle with its "Golden Ratio" of 3:4:5 to split the fifteen degree angle difference between 45/45 fractal expansion (base twelve hypotenuse) and the 30/60 gnomonic expansion (base ten hypotenuse).
These lengths for the hypotenuse/radius of the square/circle are derived by continuing to follow the gnomonic and fractal expansion rates up to base 12,13,16 areas.
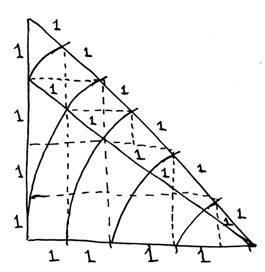
Here are all the fundamental measures for the Pythagroean square/circle formula for any figure up to circle radius eight.
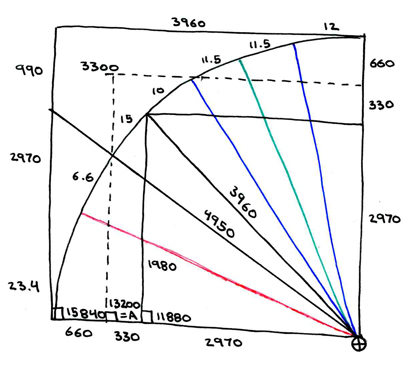
All of this is quite a bit more useful than you might at first think of it. Consider that, using this method, you can find the area of the earth. Consider the following chart, incorporating actual distances and degrees relative to our little blue jewel.
The red line indicates the tilt of earth's rotational axis from perpendicularity to the ecliptic plane of the rest of the objects in our solar system. The green line represents the precession of the gravitational, geographical pole. The blue lines represent the current variable offset, 11.5 degrees, between the geographic and the electromagnetic poles.
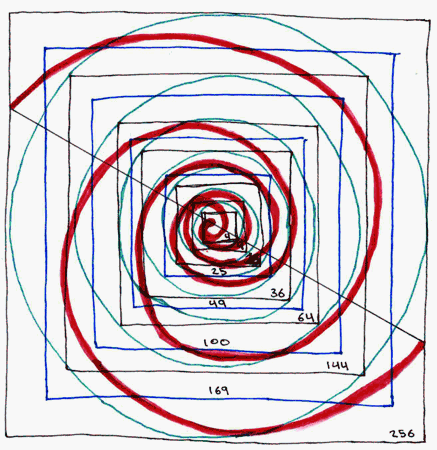
Here is a depiction of some of the smaller applicable scales of squared circle, particularly those from the two square (with area four) through the eight cube (area sixty-four). Note the special cases applied at certain points of intersection between the squared circles.
As you can see, by attaching an arc from each "special case" in point in the above diagram (depicting the very small square circle areas), one forms two spirals, one spiral arm whose angle of inclination (36 degrees) is determined by the angle of the Pythagorean triangle (let this spiral be called PHI), and one spiral arm whose angle of inclination (45 degrees) is determined by the other angle, of the "equiangular" triangle (let this second spiral be called PI).
Here is a diagram depicting the complete two spirals for up to area 256 (square circle sixteen):
the Pythagorean Spiral
It should be noted that arithmetic expansion occurs unilinearly, as a diaganol vector on a cartesian coordinate graph.
Now, exponential expansion occurs when the exponent of the integer is increased. For example, if one takes the exponential expansion of the numberline of arithmetic expansion, such that, 1^2, 2^2, 3^2, etc... where it then forms the summed numberline, such that, 1, 4, 9, etc....
A third kind of expansion rate exists, however it has been considered more or less esoteric, because it forms a very specific inherent pattern when graphed. This kind of expansion rate is associated with the Fibonnaci sequence of numbers, such that, 1, 1, 2, 3, 5, 8, 13, etc... where the rate of expansion is determined by the addition of only the preceding two numbers to form the sum digit third in the sequence. When this sequence is graphed as points around an origin in a cartesian grid, it forms a spiral, and this spiral has been found everywhere throughout nature, from the branching patterns on plants to the proportions of the human body. This is the pattern I call, for shorthand, phi.
Phi over Pi can be easily demonstrated using simple mathematics.
Apply the Pythagorean theorem, thus: (for any right triangle with legs A and B and hypotenuse C) a^2+b^2=c^2.
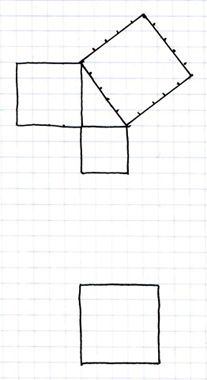
This can be depicted with a triangle surrounded by three squares. The base (number per side) of each square will be a sequential progression, such as 1,2,3. Thus, for example, the square of 3 plus the square of 4 equals the square of 5.
As I have described, there are three forms of expansion rate in three dimensions. One is arithmetic, one is exponential (Pi) and one is the Fibonnaci sequence (phi).
First let's look at the arithmetic rate as it relates to the Pythagorean theorem, and then we will see how to combine the exponential and Fibonnaci sequences using the Pythagorean theorem and thus to create a three dimensional representation of phi/pi.
This graph shows us the arithmetic expansion rate in two dimensions. From the square of 3 units (base three) in the lower right to the base 8 square in the upper left, the basic unit of measure (the square of base one, or the one by one square, also called one squared, written 1^2) is here the same throughout.
Now, let us begin to look at what happens to this arithmetic expansion rate graph when we apply the Pythagorean theorem. To do this we must first construct the following graph, complementary to the preceding graph, and then we can combine the two using the Pythagorean theorem.
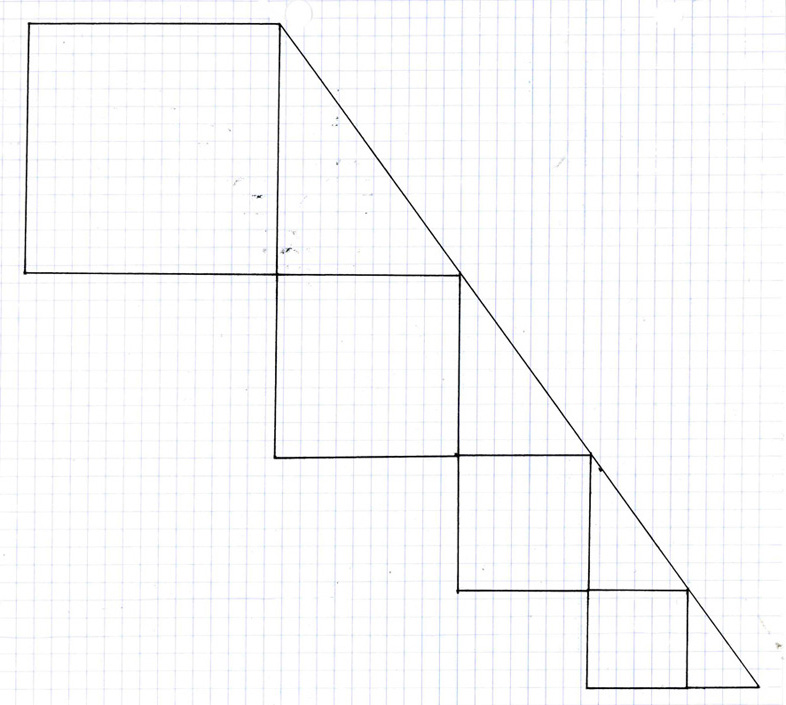
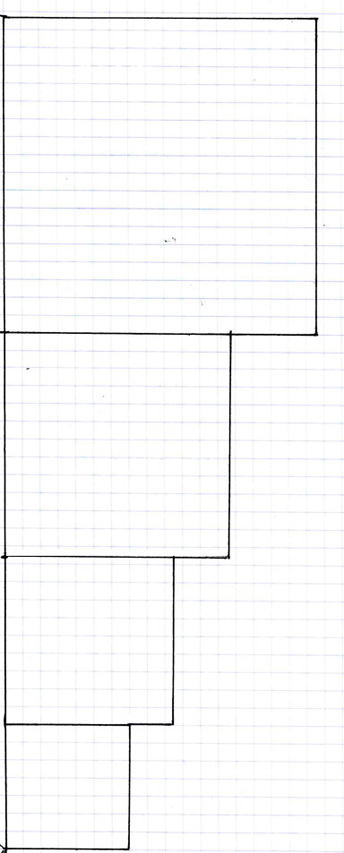
Although it differs from the shape of the last one, this graph also expresses arithmetic expansion. Just as the last graph had shown us the squares from three to eight, this graph shows us the squares from base five to base nine. While the graph of three to eight showed us arithmetic expansion along a forty-five degree angle, this graph, from base 5 to 9, shows the same expansion rate when it occurs along a right angle, that is, a straight vertical line. Thus, here, the arithmetic expansion rate is expressed by the growth from one square to the next by one base unit at ninety degrees from the vertical line.
Now let us combine these two graphs, the one from base three to base eight along a forty-five degree angle and the other from base five to base nine along a ninety degree angle, using the Pythagorean theorem, and see what we find out for the arithmetic rate of expansion.
Here we can see the result of combining these two arithmetic rates of expansion to form a Pythagorean triangle, from which we can then derive the Pythagorean mathematical theorem of trigonometry. In the lower right corner we find the standard Pythaogrean triangle formed by the base three and four squares when we apply the base five square to them at a 54° angle. The Pythagorean triangle is thus formed from the 90, 36 and 54° angles between the base 3, 4 and 5 squares. However, beyond this we observe the 54° angle at which we have tilted the previously vertical graph and the 45° angle of the other graph diverge, and that there appears to be no further congruency between the measurements of the two sets of squares.
Therefore, the results of applying the Pythagorean theorem to the arithmetic expansion rate is that it yields a discrepancy between the alignments of any of the squares formed of the original base unit along an increasing degree defined by the difference between the 54 and 45° angles. All of this can be used in two-dimensions to model how artihmetic expansion occurs relative to the Pythagorean theorem. In arithmetic expansion, the size of the base unit is constant, and each interval increases the measurement by one of the same size basic units, the one by one square, or, simply, 1^2.
So, next let us look at the exponential rate of expansion, and apply the same, step-by-step process as before to compare it to the arithmetic rate of expansion using the Pythagorean theorem triangle that we used to build the arithmetic expansion model, and finally we can compare the exponential model with one based on the Fibonnaci sequence, also by using the Pythagorean theorem triangle.
First, let's begin with the basic 3,4,5 square Pythagorean triangle. Here we see that each of the three sides of the triangle is comprised of a single base unit of measurement, the one square. All this means is that, if we draw a five by five square, and turn it at a 54° angle, it will complement the squares of 3 and 4 that use the same unit measurement. This assertion is self-evident to the arithmetic expansion, and taken for granted in most Euclidian geometry. However, for this next part we will need to consider the base unit (1^2) being alterable and relative.
Having looked at the standard Pythagorean theorem triangle of sides 3,4,5, and seen that, using a constant base unit, we cannot combine the 45 and 90° graphs of the arithmetic expansion rate, let us now consider how to plot a similar graph for the arithmetic (pi) expansion rate using the Pythagorean theorem triangle.
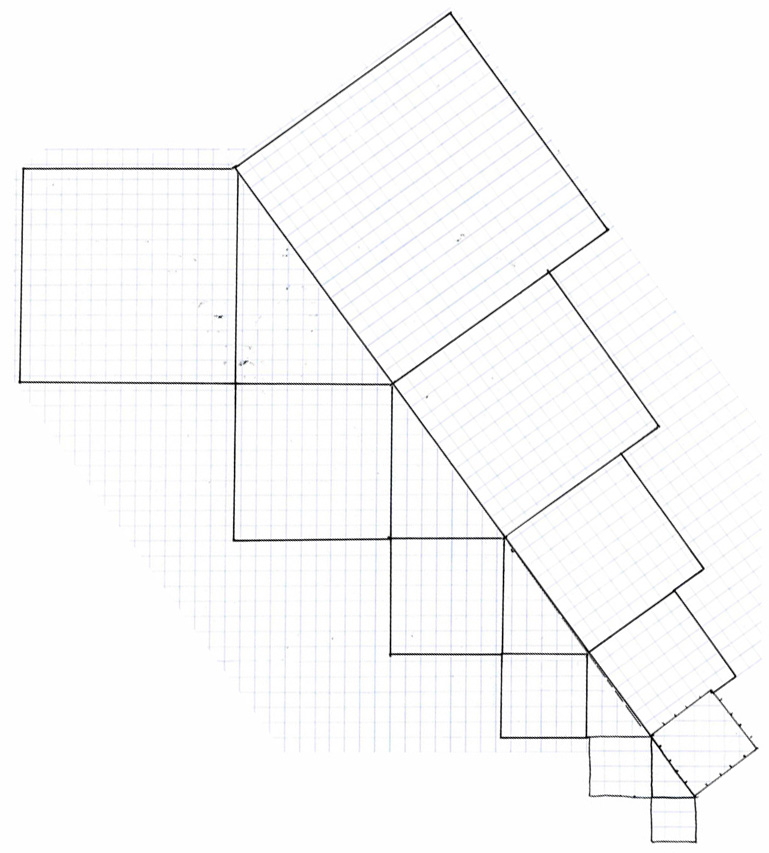
This is a series of expanding squares constructed at the angle of inclination of the Pythagorean theorem triangle (54°), instead of at the 45° angle of inclination of the arithmetic rate of expansion graph. Here we can see that, beginning with the smallest increment of Pythagorean theorem triangle larger than the 3^2+4^=5^2, or simply the 3,4,5 triangle, that is, beginning with the Pythagorean triangle whose shortest side length is 4, in the lower right corner, and then continuing up at 54° to the square in the upper left, we see there is a definite expansion from one increment to the next, and that this rate of expansion yields a larger sized square than the same number of increments on the 45° angle arithmetic expansion graph. In point of fact, the expansion rate only appears to have increased between the arithmetic and the exponential rates of expansion. In truth, it is not the size of the squares that is expanding. It is the base unit. The 1 square.
This fact becomes more apparent when we observe the exponential rate of expansion at ninety degrees (right-angled) rather than at a 54° angle. Again, this graph is the same graph as that for artihmetic expansion wherein there was the addition to each increment of one base unit at right angles to the vertical sequence. The only difference between the artihmetic and exponential expansion rates is that, in the arithmetic expansion rate, the base unit (1^2) has a constant measurement, however, in exponential expansion, the base unit increases at a rate determined not by 45 or 90° angles, but instead by 36 and 54° angles. Therefore, just as the last graph represented exponential expansion at 54°, this graph depicts exponential expansion at 36°. However, I can't stress enough that this 36° angle exponential expansion rate graph is identical to the 90° angle arithmetic expansion rate graph, and that the only real difference is the angle of perspective from which we, the subjective observer, are viewing the same specific shaped objects. In short, the base unit appears to increase only because of foreshortening of perspective. In other words, the one square is always the one square, but if we rotate it, we can observe various different relationships based upon it occuring at various different angles relative to it.
So, let us take the 36 and the 54° angles of exponential expansion rates and combine them using the Pythagorean theorem.
This is the result of combining the 36 and 54° angle exponential expansion rate graphs. Here we see that, because the expansion rate occurs at the same angle as that of the Pythagorean theorem triangle, the squares formed by the exponential expansion rate perfectly align to form a series of incrementally increasing Pythagorean theorem triangles. We can say that these triangles and squares are all congruent to their smaller and larger counterparts because the only difference between them is the size of the base unit (the one square) that comprises their fundamental measurement. In this graph we see that, had we stayed with the same base unit (the one square) that we used to construct the smallest increment Pythagorean theorem triangle (the 3,4,5 in the lower right corner), then none of the areas of the rest of the squares of equivalent triangles would be exactly equal to a round integer of 1X1 base units. Again, in point of fact, the only other known Pythagorean triangle than the 3,4,5 Pythagorean triangle (aside from the multiples of the 3,4,5 triangles such as 6,8,10) that has squares of exactly even integers in the same unit base (the one square) as the 3,4,5. This other Pythagorean theorem triangle does not occur until the smallest square is equal to 693 1^2 base units, the larger square equals 2045 base units per side, and the middle sized square between them is equal to 1924 square base units.
So, having now completed the process of contrasting the arithmetic and exponential expansion rate Pythagorean theorem triangles, let us compare the sequence of Pythagorean triangles that expands exponentially (pi) with the Fibonnaci sequence type of triangle (phi), to determine how they relate and compare.
To do this will take three steps.
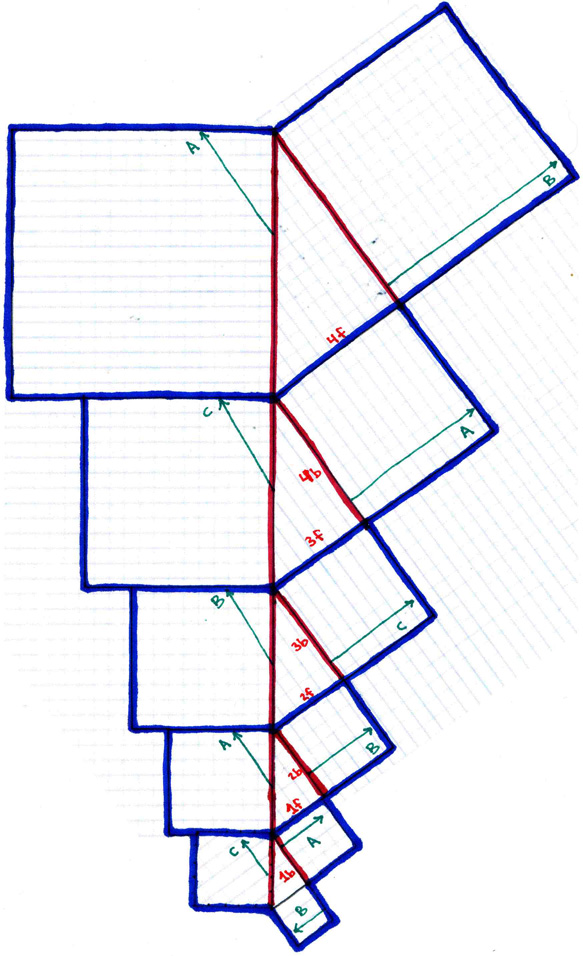
First, we take the "straight" sequence of exponentially expanding equivalent Pythagorean triangles and label it as above. The blue lines represent where to cut to separate between the increments. The red lines represent where the increments fold when they are correlated using the phi spiral. The green lines represent where the folded incremenets align.
So, to complete this step, print out the above diagram, cut it into five separate pieces along the blue lines, then tape the back of one each larger increment to the front of each smaller increment following the series of numbers indicated in red (thus: tape the front, coloured side of "1f" to the back, blank side, behind the label "1b" of the next smaller increment, and tape the back, blank side behind the label "4b" to the front, coloured side of "4f" on the next larger increment), and arrange the cut and taped pieces such that they appear thus:
Represented in red, you can see in this cut and taped together version the beginning formation of the equiangular spiral that I will compare to the accute angled spiral in the next section. The equiangular spiral is equivalent to the exponential expansion rate of Pythagorean triangles. Thus, the equiangular spiral is equivalent to pi, since pi is equivalent to the exponential expansion rate of Pythagorean triangles.
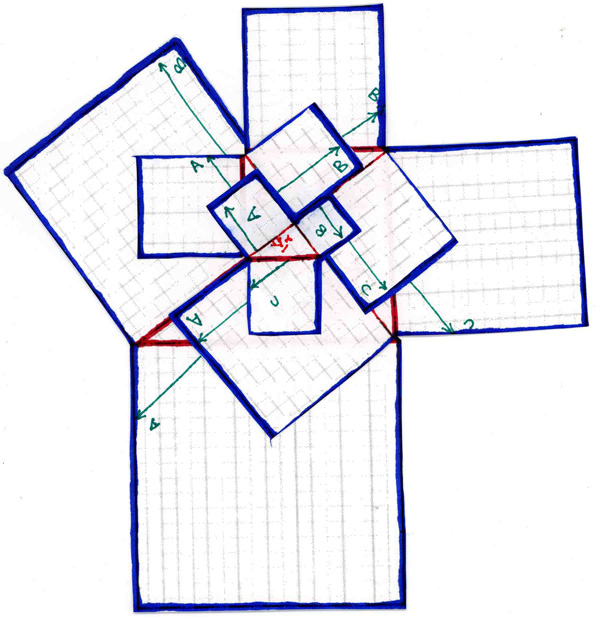
However, as you can see, the letters along the alignments of green arrows do not all match each other in the cardinal quadrants. There is still one more step of topological transformation to complete before we see the final phase of this model comparing the pi exponential expansion rate with the Fibonnaci rate of expansion.
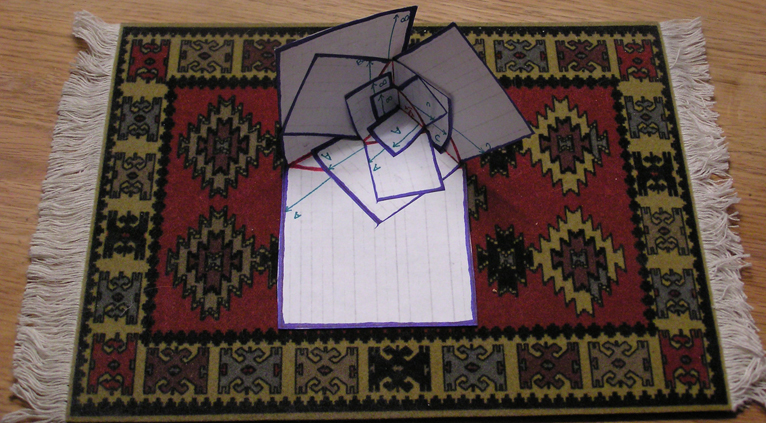
To complete the final step in creating the phi/pi model in three dimensions, and thus combining the equiangular spiral of the Pythagorean exponential expansion rate with the accute angled expansion rate associated with Fibonnaci's sequence, we only have to fold and paste the model four times, connecting the letters of each increments three green arrows with the same lettered arrows of the increments smaller and larger than it. The result of this is that now the red outlined Pythagorean (or pi) spiral is complemented by the three necessary directions (the green arrows) to form the accute, or triangular, Fibonnaci (or phi) spiral.
---------------------------------------------------------------
Infinite division of congruent similarities
There are essentially two terms that pertain to the Greek concept of "wholeness" denoted by the prefix "holo." Holography refers to two-dimensional coordinate mapping, such as onto a piece of paper or film. Holography allows us to view an image from multiple perspectives, as well as being able to retain the entire image in any piece of the film paper that is cut off into a smaller piece. The other currently known of form is the hologram, or three-dimensional image capture rendering in real space and time, and not using any filmic or flat medium.
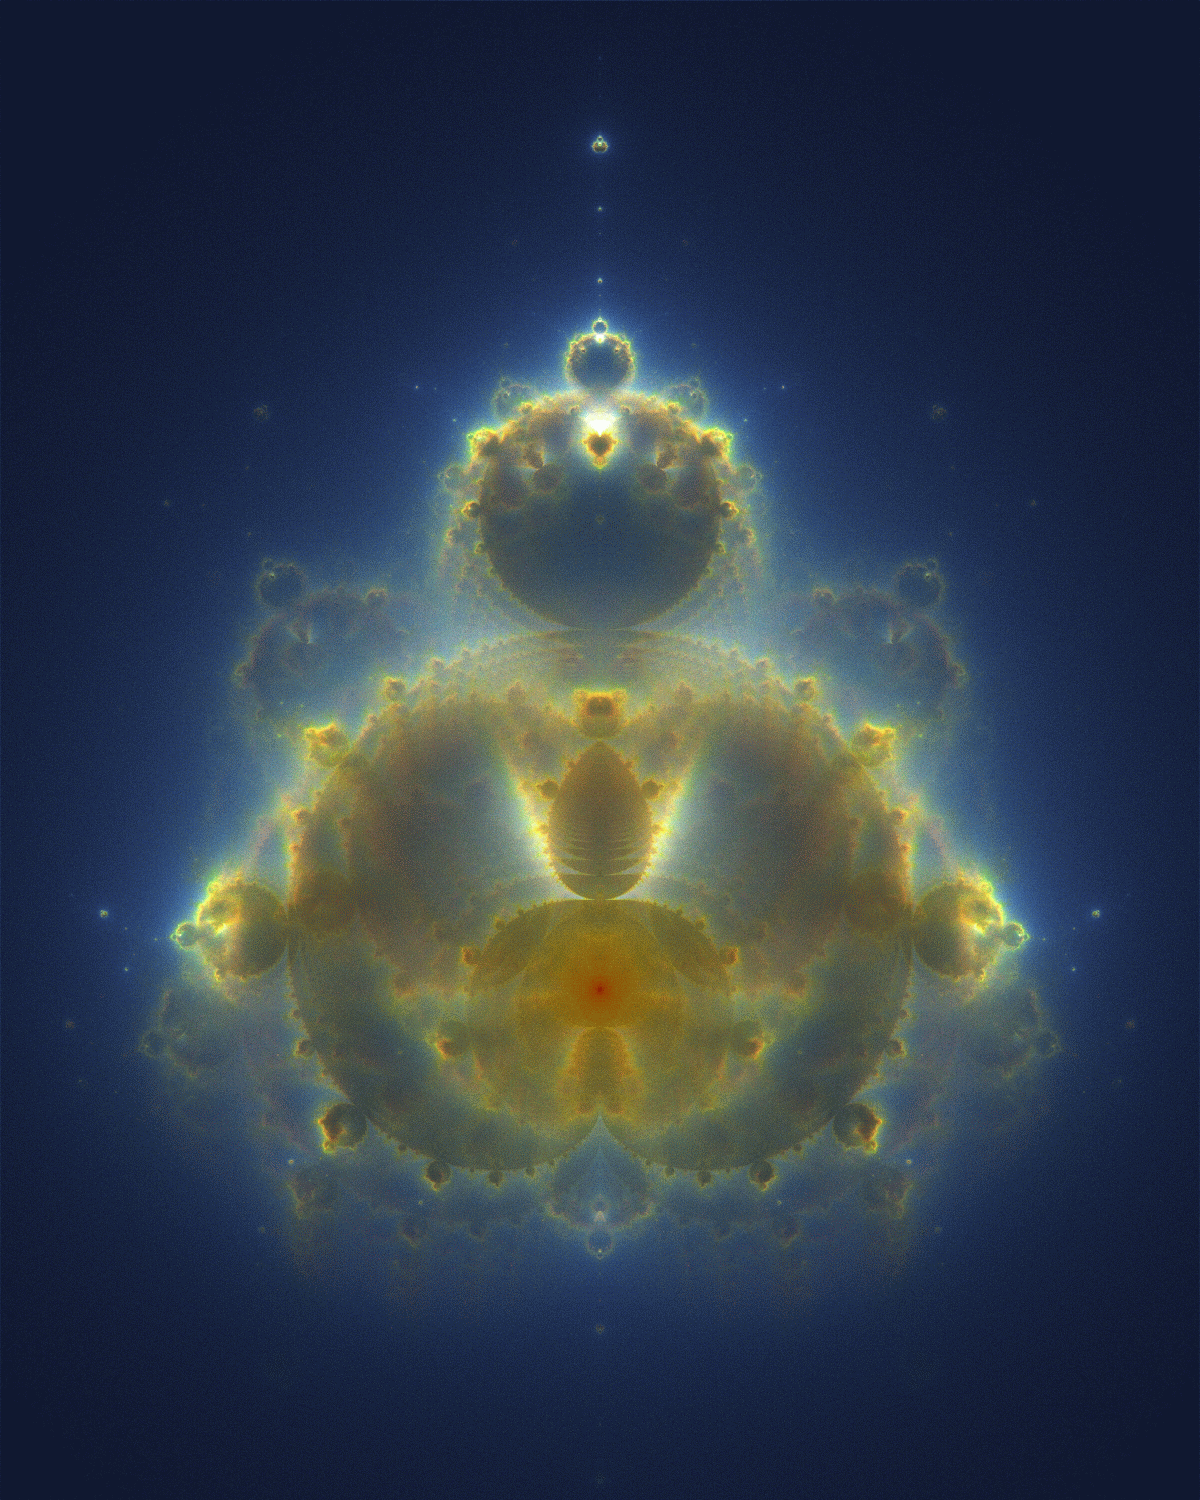
Essentially, my theory on these, apparently only two, forms of "wholeness" rendering is that holography is like the flat shape of a two-dimensional fractal image. There are many different types of two-dimensional or flat fractal sets, ranging from the Julia to the Mandelbrot to the Cantor and Menger. However what all of these have in common is that their central shape, their strange "attractor" (to borrow a term from chaos theory) is interiorly non-reducable. The centre on the inside of any fractal pattern is a place of infinite replication known as the Feigenbaum scaling function, whereby any finite number of smaller or larger segments can cover the "attractor" of the logistic map. In order to depict these "strange attractors" in three space, they have to be rotated and stretched such that measure a 3D slice of a 4D Quaternion fractal set as it is rotated (that is what renders an attractor "strange"). Here is a depiction of such a quarter twisted "strange attractor" extracted from the "dark space" of a two-dimensional fractal:
-source: http://commons.wikimedia.org/wiki/Image:QuaternionJuliaWP.png
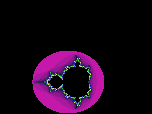
So, essentially, you can think of a holograph as a flat, two-dimensional image, such as the standard Mandelbrot or Julia sets of fractals, and you can associate the term hologram with a three-dimensional rendering of a quaternion rotation of the fractal set's strange attractor. Here are a brief example of each to demonstrate the essential difference:
 /
/ 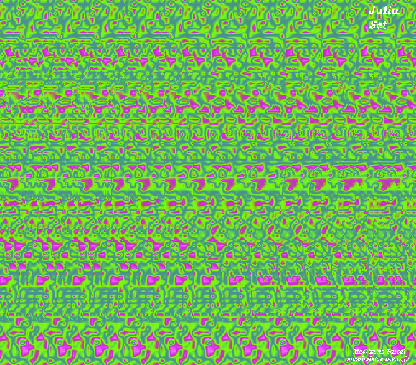
the moving image on the left is a fractal. The "magic eye" image on the right is a 3-d rendering of a "strange attractor."
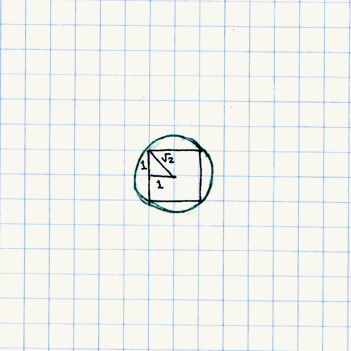
Now, I postulate their to be a third type of "implicit wholeness" theorem that can be geometrically depicted. In the same way that the holograph is the fractal edge and the hologram the strange attractor interior, so too are there a special set of fractals based on transcendental and transfinite iterations. These occur only when very certain, specific numbers are slected to form the angle and and iteration ratios that determine the edging pattern of the fractal. For example, when the number of repititions of angle replication is set to phi (1.618), then the clear pattern of a fibonnaci sequence or "Golden" spiral will appear. Another form of regularly cycling fractal pattern is based on the square root of two (the diaganol of a square with legs of one and area of one squared); we see this pattern occurs in the branching patterns of plants.
 \
\ 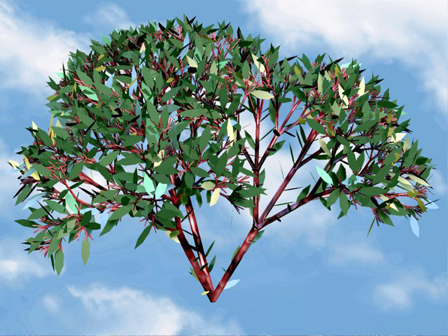
On the left we see the branching pattern of the square root of two mimicked on a computer-generated image of a fractal construction of a tree.
On the right we see the phi or Fibonacci spiral branching off from a fixed iteration of the Mandelbrot attractor fractal set.
Just as the flat edged of the fractal and the volume of the quaternion slice represented two different forms of "holo" or "wholeness" replication, th fractal's jagged edge being the holograph and the depth of the strange attractor being the hologram, so, too, does the set of all regular patterns produced by feeding back transcendental numbers onto a fractal. The name for this third type of holography and holograms is "holognomic." Here is a depiction of how such a reguarly repeating pattern can be graphed from any fractional number sequence. Here, in this design of my own, we see the iteration of "infinitely repeating halves" is used. Such shapes as are generated by graphing transcendental numbers are called "gnomons."
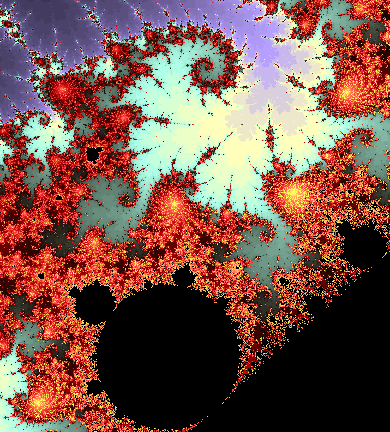
The "gnomonic" or harmonic "holo" -patterns can be thought of as the result of "auto-correlation" or of making one part of the "holo" refernetial to another, such that tab A fits slot B, etc. The finest example I've seen of applying one form of "holo" pattern to another, in order to form a more averaged ratio of difference between them, ie. a gnomon, is an effect known as the "buddhabrot." The Buddhabrot design takes the mandelbrot fractal set and converts it into a refraction (or 3-d appearing) holograph. By taking one form of holograph or self-referential pattern and applying it to another it elevates the combination of both to a higher level than their combined sum alone. The difference is the measure of the holognomon. Here is the holograph of the Mandelbrot fractal, known as the "Buddhabrot."
^click for high res^
-original image source: http://www.superliminal.com/fractals/bbrot/bbrot_rgb_small.jpg
-site context: http://www.superliminal.com/fractals/bbrot/bbrot.htm
---------------------------------------------------------------
---------------------------------------------------------------
Number Theory
Consider the following chart:
On the left we have the column of sequential integers. Let this column represent, say, time, or, say, initial members of an organisation. The column on the right represents the rate of expansion over time, or per each different original group member. The left column reads up and down, and the right column reads side to side. Here is how to read them: begin with square one, expansion rate two. Next in sequence would be to start with two, and measure the expansion rate four, etc. The chart goes up to integer five, rate of expansion thirty two, but of course you can see how applying this method works.
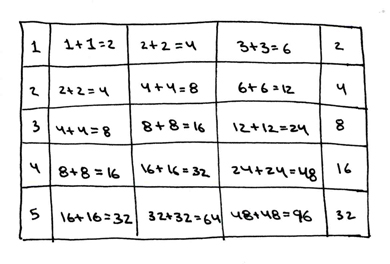
The three middle columns show some relationships we can draw across the board between sequential integers and expansion rates. 1+1=2, 2+2=4 and 3+3=6 represent the initial integers and expansion rates. The difference between each initial integer and the next across is the corresponding row on the left column. The difference between each integer sum and the next across corresponds to the expansion rate column on the right.
Basically to read across a row, you count the difference between the sums by the factor to the right. Thus: (2,4,6)=2; (32,64,96)=32. The expansion rate in the right column is the same as that for the 1+1=2 column because this entire table represents only multiples of two. 1+1=2 and 2+2=4 establish the base two system as a root function. The rest of the chart is based on multiplying each sum by two.
So, in short, this chart represents the corner-stone of the Base-Two system. There are similar charts that can be constructed for all the multiples, and it will show that, for each multiplicative step by its base number system (3,4,5,6... etc.) it will increase in the same fashion: As the sequence of integers expands "arithmetically," the column on the right, the expanson rate, will increase "exponentially."
on the tables of the eighth and the ninth
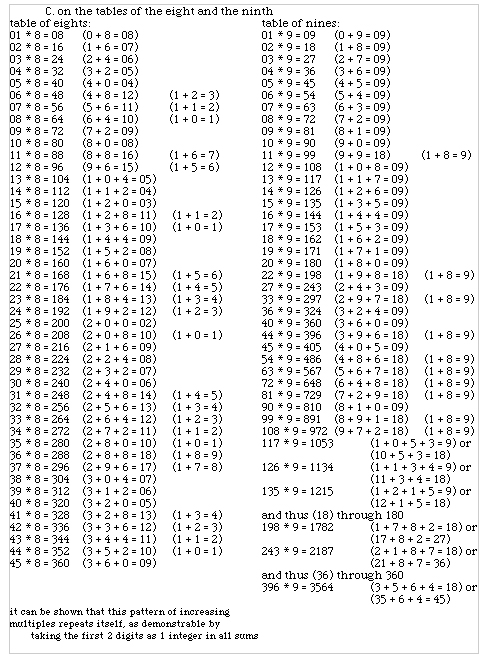
The tables of the eighth and the ninth tell us many things about the physical construction of our universe on a purely mathematical level, the level which serves as the bridge between the external formation of the material world and our relatively internal domain of consciousness. My arrangement of these tables therefore allows for the application of numerology, or the realization of relationships between the digits en-soi, or in themselves. This existentialist approach to computation is as ancient as the human practice of collecting objects in countable sets, and constitutes an esoteric equivalency to the exoteric fact of pure traditional mathematics. Regardless of the excuse of its origins, this practiceąs credentials are frowned upon in the light of pure mathematics as an escape from the understanding provided by methodological calculation. They are, quite to the contrary, no more than a reapplication of methodological computation on an entirely other level, self-contained and non-threatening to the approach of exoteric mathematica. Thus, while their examination may be seen as untraditional, it is at least not unacceptable.
One of the fundamental insights of the tables is provided by comparison between the two. Their primary similarity is the repetition of pattern; their primary difference being the nature of these patterns. As the eighth demonstrates quantifiable decline in sequence, so the ninth yields first exact self-replication, and then increasing self-referential sequentialism. These patterns are apparent and undeniable. If the calculations are repeated in any other setting the conclusions will be exactly the same, and therefore the patterns displayed in their relationships will be identical. Numbers do not lie. They lack that motivation for symmetry.
It is possible to see these sequences of both as related to one another dimensionally. The perpetual numerological decline of the eighth and the perpetual numerological duplication and factorial increase of the ninth may be seen as ascent through the first three dimensions respectively.
The diminishing table of eights constitutes collapse into a singular point in space. Naturally one can question how there can be any differentiation at all in the measurement of a point, but the answer is a simple one indeed, for without it there would be no scale-correspondent maps.
The repetitive aspect in the nines resembles the extension of a line in space. At all points along the line two of its dimensions are canceled, leaving only the third behind to mark its position. This is quite obvious in the graphing of a straight vertical or horizontal line in a two dimensional Cartesian coordinate system, where either the x or the y coordinate pairing remains undefined. It may be less obvious in a diagonal, where every point on the line has a defined x and y coordinate pair that differs from every other coordinate pairing of a point along the line. However the distance formula shows that any two points on a graphed straight diagonal will cancel one another out leaving only one integer behind, that being the value of the line itself. This may seem trivial now, but it is essential for understanding the next comparison of the ninth table to dimensionality. One need only to consider that a line in a two dimensional coordinate system, straight or diagonal, is equivalent to a plane in a three dimensional coordinate system to begin to apprehend why.
Although it is a confirmable fact that the integer sums of the multiplicative quantities produce a doubling of results along factorially related lines throughout the entire ninth table, this only becomes really evident after the process has entered its third repetition, when the quantities involved are of such an amount that their sums render divergent factors. What this process is in fact describing is the event of entrance into the third dimension from the second. At first, as the plane is defined as two lines of value nine, the factorial sums elevate rapidly through the established sequence. As the shape becomes clearer while the coordinate system is rotated the number of quantities between the factorial transitions becomes greater, allowing, as it were, more time to pass between phase shifts. The key to understanding the shape that is described is contained within the non-numerological pattern of table nine.
The factorials diverge first after product 180. That is, their sums if taken by pure integer alone or by combined integer render different results, although both results that occur elsewhere as quantities within the initial multiplicative table. At quantity 108 the products break from the ascending sequence and linger at sum 18, or, if they are taken as a pair of paired integers, begin to decrease along the same factorial lines, beginning at 63, but skipping every other factor, such that the next result yielded is 45, rather than 54, etc. This is the case until 180 appears again as the multiplicative function. The result for 198, that immediately following 180, is peculiar, as it constitutes a different rate of change than has been previously established. Although it describes the results for all the quantities of multiplication between 181 and 240 (interrupted only by 200 * 9 = 1800), this still describes a much shorter set of numbers than are contained within the 36 factorial grouping from 241 to 390 which follows, 58 as opposed to 148 respectively. This anomaly also helps to point out that the phase shifts in sums donąt occur cleanly at factorially defined breaks, but are governed only by the dictates of the digits themselves. Although this opens up the realization of still another, more subtle pattern ‹ the difference between the clean factorial 243 and the true break of 240 for the 27 factorial set being 3, and the difference between the clean factorial 396 and the true break of 390 for the 36 factorial set being 6 ‹ it is unnecessary at this point to go into it in detail.
It is more instructional, from a dimensional emergence perspective, to examine the factorial breaks that are clean, and those are 180 and 360. These numbers are most immediately recognizable as the definitions of the circumference in degrees of a half circle (the angle measure of a straight line) and a full circle (or, if you like, the angle measure of a straight line that reverses its own direction). But they have more, deeper connotations than this.
The most fundamental polygons are the triangle, the square, and the pentagon, composed of 3, 4, and 5 angles respectively. The hexagon, with 6 interior angles, is somewhat more complex, and can actually be tallied to be the sum of 2 triangles. The sum of the angles of a triangle is 180. It is always, exactly, and only 180. The sum of the angles of a square is always 360 (90 + 90 + 90 + 90). This is true for any 4 sided rhombus, according to the formula that (n - 2)180 = sum of the interior angles for any object with n number of sides. Applying this same formula we can conclude that the sum of the angles of a pentagon is 540, or 3 * 180, 1 & 1/2 times around the circumference of the unit circle. These numbers are as old as the act of measurement itself, and they are absolute. So we can see how the clean fractional breaks in the ninth table pertain not only to angles that describe arcs, but to those describing well defined shapes, particularly the fundamental polygons, as well.
Moreover these fundamental polygons comprise the sides of the only five regular solid polygons that can exist in three dimensions. All other solid polygons, like the hexagon in two dimensions, are only combinations of these first five. The Platonic solids consist of the tetrahedron, comprised of triangles, the cube, composed of squares, the dodecahedron, comprised also of triangles, the icosahedron, also composed of triangles, and the dodecahedron, comprised of pentagons. So we have not only the description of angle measures on the unit circle, but also the sums of the angles of the faces on each of the five platonic solids, and all in a pure numerical form. It is easy to follow the progression of factorial breaks up through their ascending sequence and see how the sums constitute measures within a deepening three dimensional space, describing the unfolding of the platonic solids according to the sums of the interior angle measures of their faces multiplied by their facial sum.
It would be more probable, at this point, for a practitioner of calculatory mathematica to caution that the bad habits of a writer may be transferred to their readers, than it would be that they could provide hard evidence that this data is more conjecture than implicit organization. In either event it cannot be doubted that the dimensional bridge between function and form is crossed in the table of nines.
The bridge described herein is not altogether complicated, but is increasingly complex as more governing rules are discovered to determine each additional dimension. For example, the point may be seen as of any size under magnification; the line as definitive of angle, and implying the edge of a perfectly flat plane. Three dimensional objects are formed simultaneously of matter and energy ‹ comprised not only of charged particles, but of waves with measurable frequency related to this charge. This relativity of fundamental components and distance becomes substantial in the fourth dimension, the final to be considered here, where an object has form in both space and time, according to the measurement of intervals. All of these are descriptive of the same process, differing only in the complexity of dimension.
To understand the relationship between the table of the nines and the fourth dimension, it is necessary to lay a minimal foundation. Some formulae and models describing progression should be given, as it is by progression that time is measured. It is this process that has thus far been described, and which constitutes our bridge. Growth in biological organisms is measurable according to an exponential law for equiangular spirals that gradually approach ratio based orientation. An example of this is that governing the formation of a nautilus shell, given as r = ae kq , where r is the radius of curvature, a the area, e the natural number (2.71) found in exponential balances, k the kinetic energy, and q the polar angle of predicted curve continuation. Although it seems completely unfamiliar, this formula has been underlying our progress all along. It describes the function of the ninth table whereby the lower dimensions are evoked rapidly, and the forms of the higher dimensions more slowly. What this formula means is that the spiral of the nautilus shell is curled more tightly around its origin, rapidly forming a circularly bound core. As it continues, the arc of the shell expands to break its circular condition, and rate of growth slows. This is the same exact process as described in the numbers of the ninth table.
Now, what does this similarity have to do with the fourth spatial dimension? If the rate of growth of either a nautilus shell or the ninth tableąs factorial breaks were plotted as a sine wave, it would have high initial frequency and minimal oscillation, followed by lower gradual frequency and more pronounced oscillation. This chart describes the unfoldment of progression for either equally well. It is, itself, also a three dimensional shape. If it were plotted in a three coordinate system the sine wave would orbit about the x-axis, alternating positive and negative in the y-axis, with an expanding radius in the z-axis. If it were displayed with its compliment as well, numerically negative products of all the multiplicatives or geometrically the cosine wave, it would take the familiar form of the double helix of DNA.
Before we go into the implications of the gnomon described in the ninth table, let us first pause briefly and consider the construction of a sinusoidal wave. In trigonometry, the study of triangles, lies the basis of wave measurement. A wavelength, l, may be measured as two right triangles extending up to the endpoints from the base line of the standing wave, sharing either a common point, where the wave form crosses the base line, or the vertical leg, where the wave form reaches its peak or trough. These triangles are equivalent for a sine wave depicting circularly bounded progression, and isosceles ‹ possessing two equal length legs apiece. The method of creating the sine wave itself comes from a technique for deriving a right triangleąs non-right angle measurements from the measures of its legs and hypotenuse. The sine function for an angle is the opposite leg over the hypotenuse; the cosine function for the same angle being the adjacent leg divided by the hypotenuse. These two functions, as it was stated before, are complimentary. This is expressed in the relationships between sine and cosine for a triangle ABC whose right angle is C: sin A = cos B and cos A = sin B. When the numerical solutions of these functions are graphed, a sine wave appears, which is a spiral in three dimensions. As a measurement of interval, this is also a fourth dimensional shape.
Now we may consider the progress through dimensions of the described spiral as it breaks from circular boundary conditions and what form it takes after it does so. The first point that should be made is the distinction between degrees and radians. Both are measurements of the arc of a circle, or the radial expansion of a spiral bound by circular or exponential conditions, but the former is fixed and the latter is open. Radians, unlike degrees, are dependent upon the transcendental measurement of pi, an irrational integer whose value is roughly 22/7 or 3.1415926. Pi, or p, is an expression for the ratio of the circumference of a circle to its diameter. The relationship between degrees and radians is such that each pradian = 180°. It is interesting to note that a spiral column of tetrahedrons, such as Buckminster Fuller modeled for the geometry of a double helix, undergoes 1/3 full rotation while 22 of its faces are exposed. Thus p is the limiting factor for the spiral in its early stages of progression, as it crosses the threshold of the first two dimensions. As it enters into the third, the forms it describes become exponentially complex, and the time interval elapsed between factorial breaks therefore begins to widen.
The limiting factor remains a transcendental number, an irrational integer similar to p, but one that describes an open set for growth along dimensional lines. This integer is phi, f, and will be shown to occur in pure mathematics, quantum mechanics, and the helialical pattern of DNA. It is this number that governs the third dimensional forms derived from the ninth table, as well as the fourth dimensional pattern of their progress. In order to decant f from the table of nines we need only convert the products given to degree measurements, a process already implied by the clean factorial breaks occurring at the 180 and 360 multiplicatives. Once this is done a chart for the sine and cosine functions of these angles may be assembled, and, using larger, later occurring sums for these, f will be revealed. The (2 sin)2 and (2 cos)2 sums are preferred, and yield results containing both phi and phi prime, f1, that is the reciprocal of phi, or f/1. Some of the most notable results of this table are, for 9° or p/20 radians: 2 - *(f + 2), 2 + *(f +2), sin and cosine functions respectively; for 18°, p/10: f1 + 1, f + 2; for 45°, p/4: f + f1 for both; for 72°, 2p/5: f + 2, f1 + 1; and for 81°, 9p/20: 2 + *(f + 2), 2 - *(f + 2). The complimentarity of the sin and cosine functions is readily apparent here. These figures represent distance relationships between points on what is called the Golden Triangle of 36° by 72° by 72°, after f, which is itself the Golden Ratio of (1 + *5)/2, with approximated value of 1.61803. Some other properties of note possessed by f are that multiplied by its reciprocal, the value of which is -0.61803, its product is -1, and that squared it is equal to itself plus 1. The spiral described by f is thus the so-called Golden Spiral, and is exponentially bounded rather than circularly, its points being f, f2, f3, f4, f5, and so on. These constitute the bridging of dimensional gaps described by the tables of eights and nines, and the slower, more numerous three dimensional forms that arise by angle sum recurrence during the later stages. It is interesting to note that a line connecting two points on opposite sides of a third point in a pentagon forms a line that, intersected by another such line drawn from the third point, forms the Golden division. Thus, not only is f determinant of the rate of third and fourth dimensional progression, but a fundamental building block in the Platonic forms themselves.
---------------------------------------------------------------
---------------------------------------------------------------
