---------------------------------------------------------------
---------------------------------------------------------------
IMG113

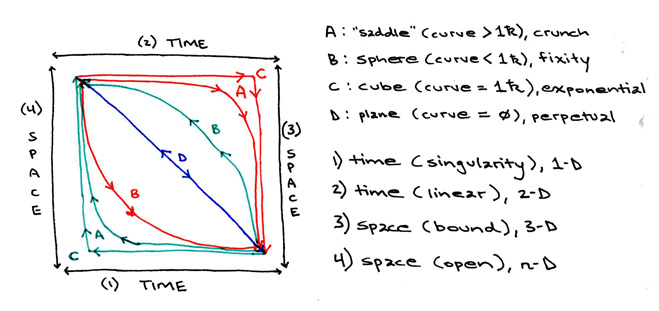
This diagram represents several basic ideas of cosmology.
the red lines represent the axis between 2-time and 3-space, or, in other words, how we perceive our own universe, beneath the photic speed of light.
the green lines represent the axis between 1-time and 4-space, or, in other words, the possible contents of the portion of our universe (or multiverse) that exists above the speed of photons in a vacuum.
The blue line represents, essentially, the Main Sequence for the sum over histories (space/time) for our own universe, and thus, after a fashion, also represents the point of Critical Mass of its expansion.
the lines labeled A are asymptotes, while those labeled B are quarter circles.
the lines 1 & 2 are parellel, and are perpendicular to lines 3 & 4, which are also parallel. This may also be understood by the formula that all four lines are perpendicular to one another, and the diagrammatic shape is not a square, but a quarter-turned tetrahedron.
Discuss this section on the forums
---------------------------------------------------------------

---------------------------------------------------------------
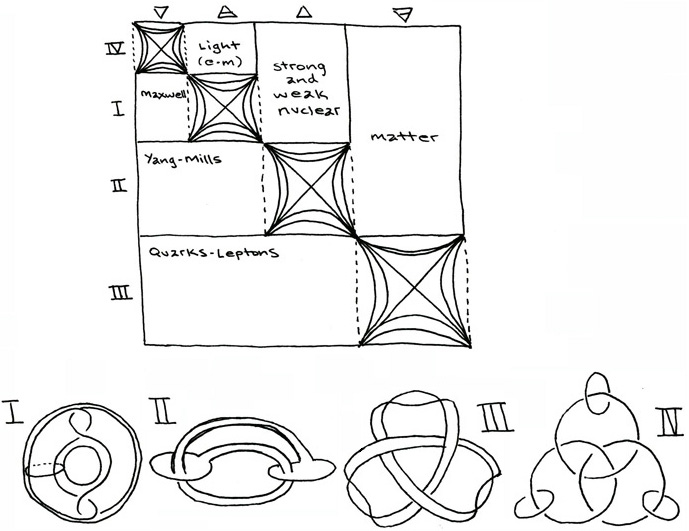
Super-Reimann metric tensor - static DeSitter tensor combined.

I. here we see the event horizon of space defined by the Maxwell equations for Einstein photic light to the Reiman metric tensor (the flat circle on the left). Permeating this at right angles is the sum over histories of all photic light particles (the toroidal 4-manifold).
II. This picture represents the mutual attraction/repulsion of the strong and weak nuclear forces. The weak force (the flat circle on the left) is both attracted to and repelled by the strong force (the flat circle on the right). This diagram viewed from above one of the flat circles would represent the Lorenz strange attractor. This models both the gravitic force on galactic scale and on atomic scale.
III. this diagram represents the same as the lowest or fourth diagram on the time_diagrams.jpg linked to above. It depicts the same force as guides the sum over histories toroid for the sub-photic local universe, guides the gravitic strange attractor of galaxies and atoms and, as seen here, the curling of the hyper-spatial trans-temporal (hyper-dimensional) superstrings around the vibrational frequencies of matter-energy into Calabai-Yau shapes, of which this trefoil is a Poincare section.
IV. This diagram shows the one sided trefoil surface unfurled, or the extra dimensions which wrap around quantum particles opened up.This represents the intersection of three toroids (as seen in position I) forming the three right angles of our spatial dimension surrounded by a holographic extra dimension of time. These are the conditions inside the singularity of a black hole.
Discuss this section on the forums
---------------------------------------------------------------

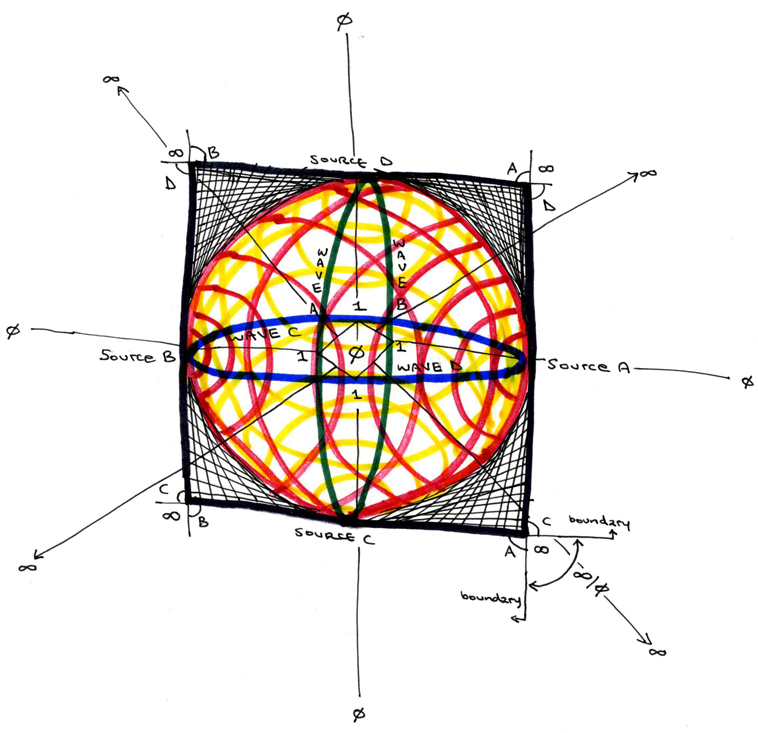
This is a hypersphere, the product of the overlap of four origin points emitting waves (sides emitting red, top and bottom emitting yellow), depicted as the motion or entropy of a dual-orbital, or two-dimensional, sphere, formed of two elliptical circumferences (the green and blue ellipses). In its centre is the DeSitter metric tensor where the red and yellow waves intersect within the blue and green circumferences. The black outline of the square around the circular hypersphere field is the basic model for how an electromagnetic field warps around a stationary gravity well. The idealised black square outline depicts the boundaries, or limits, of the wavelengths emitted from their midpoint perpendicularly.
Discuss this section on the forums
---------------------------------------------------------------
---------------------------------------------------------------
